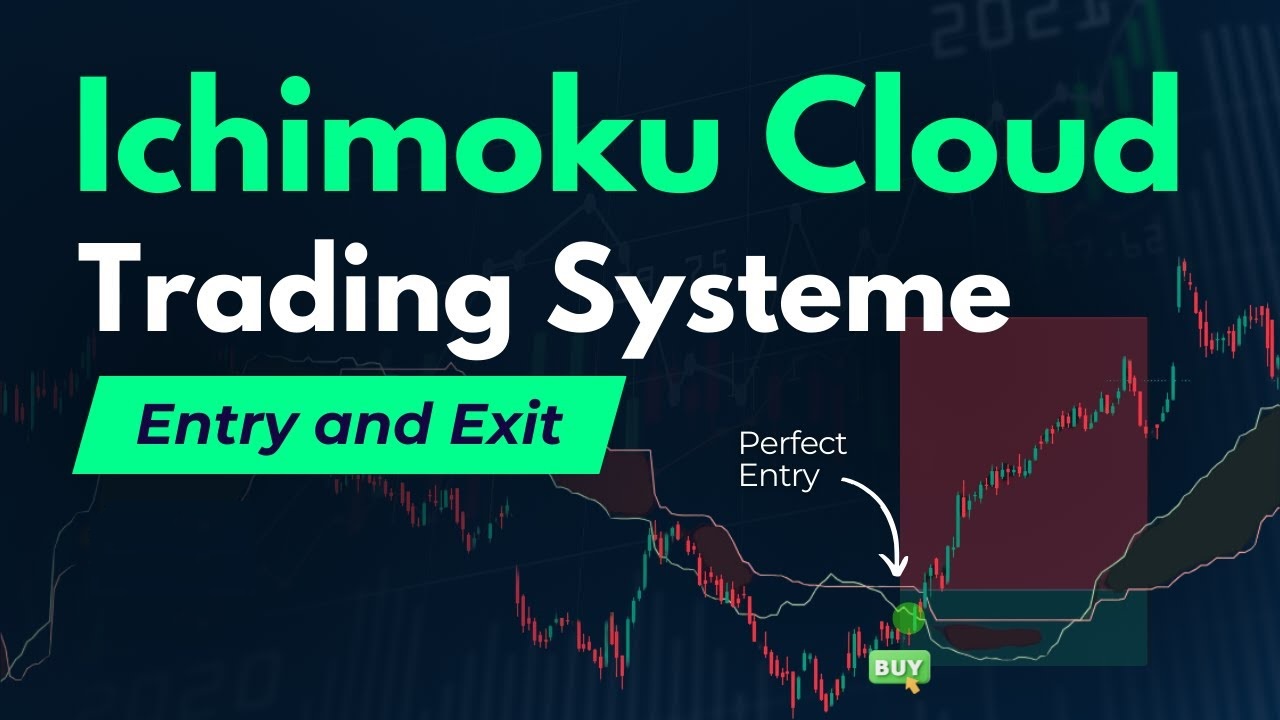
A flexible technical indicator, the Ichimoku Cloud, also called Ichimoku Kinko Hyo, offers a thorough analysis of market trends, momentum, and possible support and resistance levels. Developed by Japanese journalist Goichi Hosoda in the late 1930s, this indicator offers traders an all-in-one framework for understanding price action and forecasting future price movements.
Whether you’re new to trading or an experienced investor, understanding the Ichimoku Cloud can offer valuable insights to refine your trading strategy. This article breaks down the components of the Ichimoku Cloud and how to interpret it effectively.
What is Ichimoku Cloud?
The Ichimoku Cloud is a technical indicator that helps traders identify support and resistance levels, momentum, and trend direction. It consists of multiple lines and a shaded area (the “cloud”) that provides a visual representation of these elements. Created by Goichi Hosoda, the Ichimoku Cloud provides a quick and comprehensive overview of market dynamics.
What are the Components of Ichimoku Cloud?
The Ichimoku Cloud consists of five components that work together to provide a holistic view of market trends , momentum, and support/resistance levels. They are as follows:
1. Tenkan-Sen (Conversion Line)
This line averages the highest high and lowest low over the past nine periods, indicating short-term market momentum.
2. Kijun-Sen (Base Line)
Calculated by averaging the highest high and lowest low over the past 26 periods, it represents a longer-term market trend.
3. Senkou Span A (Leading Span A)
Formed by averaging the Tenkan-Sen and Kijun-Sen, this line is projected 26 periods ahead and forms one boundary of the cloud.
4. Senkou Span B (Leading Span B)
This line averages the highest high and lowest low over the past 52 periods and is projected 26 periods ahead, forming the other boundary of the cloud.
5. Chikou Span (Lagging Span)
This line represents the closing price plotted 26 periods in the past; it helps identify potential support and resistance levels.
Formula and Calculation of Ichimoku Cloud
The Ichimoku Cloud has five main parts, each with its formula:
- Conversion Line (Tenkan-Sen): 29-period high+9-period low
- Base Line (Kijun-Sen): 226-period high+26-period low
- Leading Span A (Senkou Span A): 2Tenkan-sen+Kijun-sen (Plotted 26 periods ahead)
- Leading Span B (Senkou Span B): 252-period high+52-period low (Plotted 26 periods ahead)
- Lagging Span (Chikou Span): Close plotted 26 periods in the past
Step-by-Step Calculation
- Conversion Line (Tenkan-Sen): You start by finding the highest high and the lowest low over the past 9 periods. You should also add these two values together and divide by 2.
- Base Line (Kijun-Sen): You start by finding the highest high and the lowest low over the past 26 periods. You should also add these two values together and divide by 2.
- Leading Span A (Senkou Span A): Add the Conversion Line (Tenkan-sen) and the Base Line (Kijun-sen) together and divide by 2. Also, plot this value 26 periods ahead.
- Leading Span B (Senkou Span B): Next, find the highest high and the lowest low over the past 52 periods, add these two values together and divide by 2. You should plot this value 26 periods ahead.
- Lagging Span (Chikou Span): Plot the closing price for 26 periods in the past.
Example Calculation
Let’s use some example data
9-period high: 150
9-period low: 130
26-period high: 160
26-period low: 120
52-period high: 170
52-period low: 110
Current closing price: 140
Conversion Line (Tenkan-sen): 150+130/2=280/2=140
Base Line (Kijun-sen): 160+120/2=280/2=140
Leading Span A (Senkou Span A): 140+140/2=280/2=140
Leading Span B (Senkou Span B):170+110/2=280/2=140
Lagging Span (Chikou Span): 140
This example shows how to calculate and plot the Ichimoku Cloud components on a chart to understand support, resistance, and trend direction.
How to Interpret Ichimoku Cloud?
The Ichimoku Cloud is a comprehensive technical analysis tool used to identify market trends, support and resistance levels, and potential trade signals. Here’s how to interpret it:
- Cloud Formation: A bullish cloud forms when Senkou Span A is above Senkou Span B; it becomes bearish when it is reversed.
- Trend Direction: Price above the cloud signals an uptrend, below indicates a downtrend, and inside reflects consolidation.
- Support and Resistance: The cloud acts as support in uptrends and resistance in downtrends.
- Kumo Twist: A Kumo Twist signals a potential trend reversal when the cloud switches from bullish to bearish or vice versa.
- Crossovers: Tenkan-sen crossing above Kijun-sen signals a buy, while crossing below signals a sell.
- Lagging Span: The Lagging Span confirms trend strength when it’s above or below the price.
- Time Frames: Ichimoku works across time frames, adjusting trend signals for short or long-term analysis.
Conclusion
The Ichimoku Cloud is a powerful technical indicator that provides a comprehensive view of market trends, momentum, and potential support or resistance levels. When used with other indicators, it helps traders make more informed decisions. While mastering its use requires practice, it offers a deeper insight into market movements, making it a valuable addition to any trading strategy.
Frequently Asked Questions
Q1. How to read Ichimoku Cloud?
The Ichimoku Cloud consists of five lines: Tenkan-sen, Kijun-sen, Senkou Span A, Senkou Span B, and Chikou Span. These lines help traders identify trends, assess momentum, and determine support and resistance levels in the market.
Q2. Why is Ichimoku so powerful?
The Ichimoku Cloud provides a holistic view of market trends, momentum, and support/resistance levels. Its unique visual representation and multiple data points make it a versatile and comprehensive tool for traders, enhancing decision-making.
Q3. What is the best time frame for Ichimoku?
The Ichimoku Cloud indicator works best on daily or weekly time frames for longer-term trading. Shorter time frames, such as 1-minute to 6-hour charts, are preferred for day trading or scalping, and they allow for quick decision-making.


